
Learn Scalping the USD/CAD Trading Strategy with Assh. Scalping is a trading technique that involves making multiple small trades in a short period. In this article, we’ll explore how to apply a scalping strategy to the USD/CAD pair using Fibonacci Retracement levels.
Understanding Fibonacci Retracement
Fibonacci retracement is a popular technical analysis tool traders use to identify potential reversal levels in the market. It is based on the Fibonacci sequence, a series of numbers where each number is the sum of the two preceding ones. Key levels derived from this sequence, such as 23.6%, 38.2%, 50%, 61.8%, and 78.6%, are plotted on a price chart to indicate possible support and resistance levels.
How to Calculate Fibonacci Retracement
Fibonacci Retracement levels are calculated by applying Fibonacci ratios to a price chart. First, to calculate Fibonacci retracement levels, identify the high and low points of the price trend you’re analyzing. Then, the Fibonacci sequence ratios (23.6%, 38.2%, 50%, 61.8%, 78.6%) are applied to the difference between these points. Plot these levels on your chart to find potential support and resistance zones where the price might reverse.
How to Trade with Fibonacci Retracement of USDCAD Scalping
To trade with Fibonacci retracement, identify key levels (23.6%, 38.2%, 50%, 61.8%, and 76.4%) and look for reversals or breakouts.
Use these levels to set buy/sell orders, stop losses, and take profits, adjusting for market volatility and trend direction.
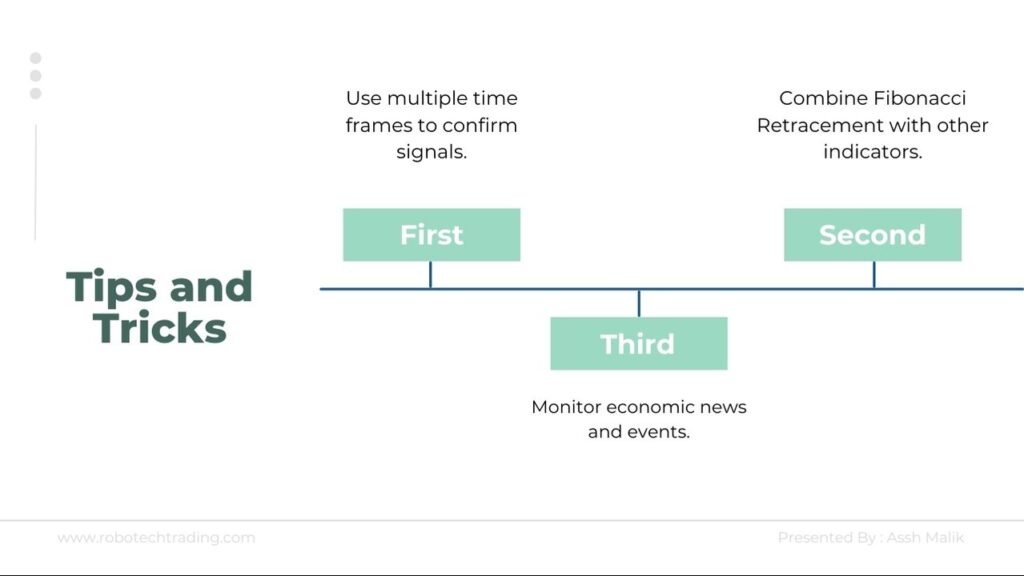
Combine Fibonacci retracement with other technical indicators, like moving averages or RSI, to confirm trading signals and maximize profitability. To trade with Fibonacci Retracement, follow these steps:
Step 1: Set up your chart of USDCAD scalping
- Choose the USD/CAD pair
- Set the time frame to 5 minutes
- Add Fibonacci Retracement levels
Step 2: Identify buy signals
- Wait for the price to reach a Fibonacci Retracement level (23.6%, 38.2%, 50%, 61.8%, 76.4%)
- Wait for a bullish reversal candle pattern
- Buy the USD/CAD pair
- Set stop-loss below the recent low
- Take profit at the next resistance level
Step3: Identify sell signals
- Wait for the price to reach a Fibonacci Retracement level (23.6%, 38.2%, 50%, 61.8%, 76.4%)
- Wait for a bearish reversal candle pattern
- Sell the USD/CAD pair
- Set stop-loss above the recent high
- Take profit at the next support level
Risk Management of USDCAD Scalping
Risk management is crucial when trading with Fibonacci Retracement. Here are some tips to help you manage your risk:
- Set stop-loss orders
- Use position sizing
- Monitor your trading performance
Summary of the Article
The USD/CAD scalp using Fibonacci Retracement is a powerful strategy. By combining this indicator with other tools and managing your risk, you can maximize your trading potential.
Where to Get the Indicators:
You can download the Fibonacci Retracement indicator for free from various online sources, including:
- MetaTrader Market (for MT4 and MT5 users)
- TradingView (for web-based charting)
- NinjaTrader (for NinjaTrader users)


