Top Strategies

EURAUD H4 Scalping with Bollinger band squeeze

EURAUD H4 Scalping Bollinger Band Squeeze

If you’re looking for a simple and effective trading strategy that balances accuracy and profit, the EURAUD H4 scalping using the Bollinger Band Squeeze is a great choice. If you’re into forex trading, you’ve probably heard of scalping. Scalping is about making quick trades to grab small profits from tiny price changes before the market moves. It can be exciting because you’re quickly in and out of the market, capturing little profits that can add up over time. Now, imagine using this scalping technique on the EURAUD currency pair. instead of looking at short timeframes like 1-minute Or 5-minute Charts, You’re Using A H4 chart. Interesting twist, right? I’m going to walk you through a strategy called the Bollinger Band Squeeze. a simple but effective way to scalp EURAUD. Don’t worry, I’ll keep things easy to follow, almost like we’re just having a casual chat about trading. What is Scalping in Forex? Let’s start with the basics. Scalping is all about jumping in and out of trades quickly, just trying to grab small profits from tiny price moves. It’s kind of like picking up loose change here and there, not a fortune with each one, but if you do enough, those small wins will start to add up.Scalpers look for those moments when the price moves just enough to make a trade worth it. Once they’ve got their profit, they’re out. It’s like grabbing a good deal at a yard sale, quick and done. If you do scalping, you don’t wait for big trends. It’s like being ready to take advantage of small changes as soon as they appear. You act quickly and grab those small moves before they slip away. Understanding Bollinger Band Squeeze for EURAUD H4 scalping Okay, now let’s talk about the Bollinger Band Squeeze. You’ve probably seen Bollinger Bands. those curvy lines that hug the price on a chart. But here’s a quick refresher just in case: Middle line: This is a simple moving average (SMA), typically set to 20 periods. Upper and lower bands: These are placed above and below the middle line, usually two standard deviations away, which helps measure how volatile the market is.When the market is calm, the upper and lower bands come closer together. this is the “squeeze.” When the bands get tight, it’s like the market is taking a deep breath, and when it exhales, the price often breaks out in a big way. How to Calculate Bollinger Bands Bollinger Bands are made up of three lines that help you see how the market is moving. Here’s how they work: These bands show you when the market is getting quiet or when a big move might be coming. how to do EURAUD H4 scalping using the Bollinger band squeeze Here’s where it gets good for scalpers. The EURAUD pair moves a lot, so you get many chances to enter and exit trades. It’s like the market is always giving you chances to trade. Instead of watching the charts all the time, you’ll use the H4 chart. This helps you easily spot when the bands squeeze together, signalling that a big price move might be on the way. Here’s how we can use this in our trades: Set Up Your Chart find the Squeeze Look for Buy Signals Look for Sell Signals In short, by waiting for the right signals, confirming with other indicators, and managing our risk properly, we can trade with more confidence and better results. Pro Tips for EURAUD H4 scalping Here’s, we’ll teach you how to improve your strategy: Risk Management for EURAUD H4 scalping Alright, now that we’ve already covered how to spot the Bollinger Band Squeeze for EURAUD H4 scalping, let’s talk about something super important—risk management. After all, we should protect our money while we trade. First, you set stop-loss orders to limit how much you could lose on a trade. This is like your safety net, helping you get out if the trade goes against you. Second, position sizing is basically about being smart with your money. You risk only a small amount on each trade so that if things don’t go as planned, it won’t hurt too much. It’s a simple way to protect yourself and keep trading without stress This helps you keep getting better while staying safe with your money. Short Recap The EURAUD H4 scalp is a great strategy that uses the Bollinger Band Squeeze to find good trading opportunities. When you combine this with other indicators and smart risk management, it boosts your chances of making profitable trades. It’s a simple yet powerful way to improve your trading game More Strategies Crafted by TradingBotLab

EURAUD H4 Scalping Bollinger Band Squeeze Read More »

5-Minute USD/CNH Scalp using Force Index

USDCNH Scalping Strategy with Force Index in 5-Minute

Scalping is one of the least time-sensitive trading techniques utilized in the high turnover FX market to make many profit-making businesses out of small price variations. The “Forceful Profits” uses the USDCNH currency pair features and applies the Force Index, an accurate variable for the strength of price trends. E-mini trading strategy: This approach offers the trader several fast, lucrative trades at defined entry and exit points in the five-minute chart. Through the Force Index, traders can be able to understand the amount of demand and supply pressure in the market, which in turn helps them make better decisions and, therefore, maximize their gains as they operate in one of the most active and volatile markets in the whole world such as the forex market. In this article, we’ll explore how to apply a 5-minute scalping strategy to the USDCNH pair using the Force Index indicator with Assh. Understanding Force Index The Force Index is a technical analysis tool that measures the amount of energy or “force” behind a price move. Dr. Alexander Elder created the Force Index to measure price movement in a market. It integrates the variation aspect, volume, and direction to give a complete picture of pressure on the market. A Force Index figure above zero means buying pressure in the previous session, and a Force Index figure below zero means there was selling pressure. The Force Index helps traders in their market for trend confirmation purposes, indicating points of reversal or even points of entry and exit in their trading activities. Using the price changes and trading volume, the Force Index shows the strength of forces within the market. How to Calculate Force Index The Force Index is calculated by multiplying the price change by the volume. Identify the Inputs: Calculate Price Change: Multiply by Volume: How to Trade with Force Index for USDCNH Scalping Strategy To trade the USDCNH Scalping Strategy with the Force Index, follow these steps: Step 1: Set up your chart for the USDCNH Scalping Strategy Step2: Identify buy signals of the USDCNH Scalping Strategy Step 3: Identify sell signals of the USDCNH Scalping Strategy Tips and Tricks Risk Management Risk management is crucial when trading with the Force Index. Here are some tips to help you manage your risk: Short Review The Force Index-based USD/CNH 5-minute scalp trading strategy can be very helpful to the would-be trader who wants to make the most of short-term fluctuations in the price action. Through the Force Index, traders are likely to have a measure of how price-sensitive the force is and the right time to enter or exit the market. The strength of this strategy is that it helps to determine the direction of buying and selling pressure more quickly and easily. This scalping method can improve trading potential and profitability if other technical indicators and sound risk management are incorporated into the scalping technique. When used correctly, these tools can be used effectively to assist traders in making better decisions in the fluctuating forex market.

USDCNH Scalping Strategy with Force Index in 5-Minute Read More »

GBP/JPY Scalping Strategy with Heiken Ashi and ADX

GBPJPY Scalping Strategy with Heiken Ashi and ADX

The GBPJPY scalping strategy leverages the Heiken Ashi candlestick technique and the Average Directional Index (ADX) to capitalize on short-term price movements. Heiken Ashi candlesticks, known for their ability to filter out market noise, provide a clearer view of the underlying trend by averaging price data. This helps you identify potential entry and exit points more effectively. The ADX indicator complements this by measuring the trend’s strength, allowing you to distinguish between strong trends and ranging markets. Combining these tools allows you to make more informed decisions, enhancing your ability to profit from quick, short-term trades in the GBP/JPY market. This article will explore applying a scalping strategy to the GBP/JPY pair using Heiken Ashi and ADX indicators with Assh Malik. Understanding Heiken Ashi Heiken Ashi is a Japanese candlestick chart that helps you identify trends and potential reversals. It is used in technical analysis to better visualize market trends and potential reversals. Unlike traditional candlesticks, which display the open, high, low, and close prices for a given period, Heiken Ashi candles average these values, creating a smoother appearance that filters out market noise. This smoothing effect helps traders more easily identify the direction and strength of a trend, making it easier to spot trends and potential reversals. By understanding how Heiken Ashi works and incorporating it into their analysis, you can make more informed decisions and enhance your overall trading strategy. Understanding ADX ADX (Average Directional Index) is a momentum indicator that measures the strength of trends. It is a technical analysis indicator used to quantify the strength of a trend in the financial markets. J. Welles Wilder develops it. The ADX is part of the Directional Movement System, including the Plus Directional Indicator (+DI) and the Minus Directional Indicator (-DI). It is a single line that fluctuates between 0 and 100, with higher values indicating a stronger trend, upward or downward. The ADX helps traders determine whether the market is trending or ranging by measuring trend strength rather than direction. How to Trade GBPJPY Scalping Strategy with Heiken Ashi and ADX To trade GBPJPY Scalping Strategy with Heiken Ashi and ADX, follow these steps: Step 1: Set up your chart GBPJPY Scalping Strategy Step2: Identify buy signals Step 3: Identify sell signals Tips and Tricks for GBPJPY Scalping Strategy Risk Management for GBPJPY Scalping Strategy Risk management is crucial when trading with Heiken Ashi and ADX. Here are some tips to help you manage your risk: Review The GBP/JPY scalping strategy, enhanced with Heiken Ashi candlesticks and the ADX indicator, offers a robust approach for short-term traders aiming to capitalize on the volatility of this currency pair. The Heiken Ashi candles provide a smoother representation of price movements, helping traders filter out market noise and identify trends more effectively. Meanwhile, the ADX indicator measures the strength of these trends, allowing traders to distinguish between strong trends and ranging markets. By combining these tools, traders can make more informed decisions, improving their entry and exit points and ultimately enhancing their profitability. This strategy requires precision, quick decision-making, and effective risk management, making it suitable for experienced traders comfortable with fast-paced trading environments.

GBPJPY Scalping Strategy with Heiken Ashi and ADX Read More »

The USDCHF Scalp using Pivot Points in 30-Minute

The USDCHF Scalp using Pivot Points in 30-Minute

Let’s start with a 30-minute scalping strategy with Assh. The USDCHF currency pair, known as the “Swissie,” is popular among forex traders due to its liquidity and volatility. Scalping, a trading strategy that involves making multiple trades over a short period to profit from small price movements, can be particularly effective with this pair. Using pivot points, a technical analysis tool identifying potential support and resistance levels, you can enhance your decision-making process for 30-minute scalping strategies as a trader. By analyzing the pivot points, traders can identify key levels where the price will likely react, allowing for precise entry and exit points. This approach helps maximize profits while minimizing risks, making it a favored technique among short-term traders. This article will explore applying a 30-minute strategy to the USDCHF Scalp pair using pivot points. Understanding Pivot Points Firstly, we understand what is Pivot Points. Pivot points are a technical analysis tool that helps traders identify potential support and resistance levels. They are calculated based on the previous day’s high, low, and close prices. How to Calculate Pivot Points To calculate pivot points, follow these steps: Step 1: Calculate the pivot point (PP) Firstly, calculating pivot points involves using the previous trading day’s high, low, and closing prices. The primary pivot point (P) is calculated as the average of these three values: PP = (High + Low + Close) / 3 Step-2: Calculate the support levels (S1, S2) Secondly, you can determine the support levels from this central pivot point. The first level of support (S1) and second level of support (S2) are calculated as follows: S1 = (2 × PP) – High S2 = PP – (High – Low) Step 3: Calculate the resistance levels (R1, R2) Thirdly, For the resistance levels (R1 and R2), use the following formulas: R1 = (2 × P) – Low R2 = PP + (High – Low) These pivot points and their support/resistance levels help traders identify potential entry and exit points by indicating where the price may experience support or resistance. How to Trade with Pivot Points with USDCHF Scalp Now we will know how you can trade with pivot points trading with USDCHF scalp. To trade with pivot points, follow these steps: Step 1: Set up your chart for USDCHF Scalp Step2: Identify buy signals Step 3: Identify sell signals Tips and Tricks for USDCHF Scalp Risk Management in USDCHF Scalp Risk management is crucial when trading with pivot points. Here are some tips to help you manage your risk: Review of Article The USD/CHF 30-minute scalp using pivot points is a powerful strategy. You can maximize your trading potential by combining pivot points with other indicators and managing your risk.

The USDCHF Scalp using Pivot Points in 30-Minute Read More »

NZDUSD Scalp with Ichimoku Cloud and Momentum

NZDUSD Scalp with Ichimoku Cloud and Momentum

Get ready to capitalize on market momentum with the Assh scalp trading strategy for NZDUSD. This strategy leverages the dynamic Ichimoku Cloud and potent Momentum indicators to pinpoint profitable trades. We’ll dive into the key levels and signals driving our trading decisions.Scalping is a trading technique that involves making multiple small trades in a short period. so now, we’ll explore how to apply a scalping strategy to the NZDUSD pair using Ichimoku Cloud and momentum indicators. Understanding Ichimoku Cloud Ichimoku Cloud is a comprehensive trading system that provides traders with valuable information about trend direction, support, and resistance.The Ichimoku Cloud is a powerful trading indicator for market trends and momentum. Do you know? Developed by Goichi Hosoda, it is a comprehensive Japanese charting technique for analyzing financial markets. Understanding Momentum Momentum indicators measure the rate of change of price movements. They help traders identify potential buy and sell signals.Momentum, a key concept in technical analysis, reflects the velocity and magnitude of price changes. It enables traders to identify emerging trends, confirm trading signals, and optimize investment strategies. How to Trade with Ichimoku Cloud and Momentum NZDUSD Scalp We will discover a winning trading approach by merging the Ichimoku Cloud’s unique trend visualization with Momentum’s actionable market momentum signals. We will harness these complementary tools to confirm trading decisions, manage risk, and achieve consistent market success. 1-minute trading of NZDUSD Scalp with Ichimoku Cloud and MomentumTo trade with Ichimoku Cloud and Momentum, follow these steps: Step 1: Set up your NZDUSD Scalp chart Step2: Identify buy signals NZDUSD Scalp Step 3: Identify sell signals Tips and Tricks for NZDUSD Scalp Risk Management Risk management and momentum are crucial when trading with Ichimoku Cloud. Here are some tips to help you manage your risk: Examples NZDUSD Scalp Now, we will discuss some examples of trades and charts illustrating how to trade with Ichimoku Cloud and Momentum: Example 1: Bullish Trade Setup Chart: NZDUSD scalp 4-hour chart Ichimoku Cloud: Momentum: Entry: First, Buy at 0.6700Secondly, Stop Loss: 0.6650Thirdly, Take Profit: 0.6800 Example 2: Bearish Trade Setup Chart: EUR/USD daily chart Ichimoku Cloud: Momentum: First of all, Entry: Sell at 1.1000Secondly, Stop Loss: 1.1050Thirdly, Take Profit: 1.0900 Key Points: Remember that these examples are hypothetical and not intended as investment advice. Overview Using Ichimoku Cloud and momentum, the NZDUSD scalp is a powerful strategy. Combining these indicators and managing your risk can maximize your trading potential. More Strategies Crafted by RoboTechTrading 1- Scalping Strategies2-Trend Following Strategies

NZDUSD Scalp with Ichimoku Cloud and Momentum Read More »

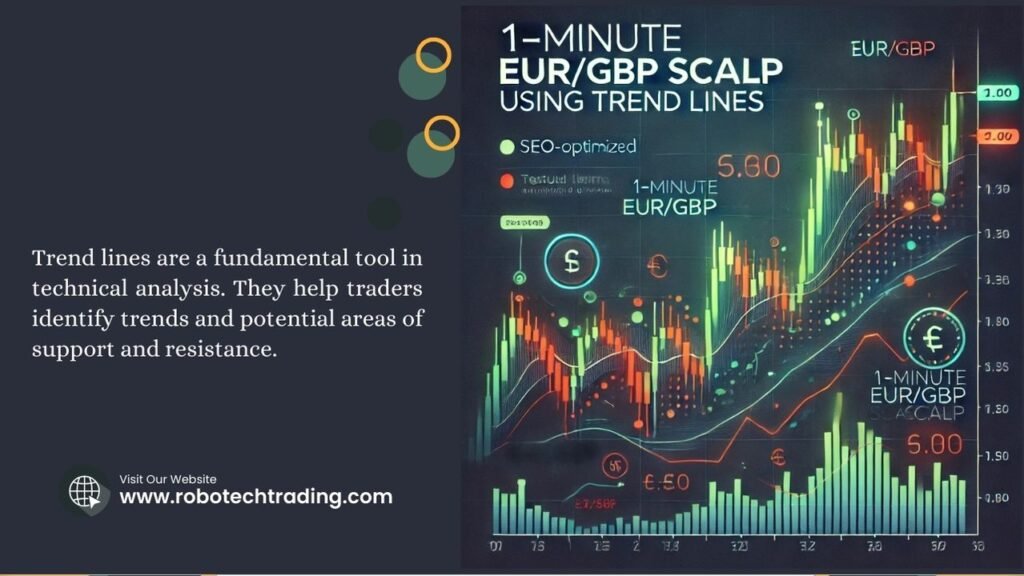
rend Line Lightning: 1-Minute EUR/GBP Scalping Strategy for Quick Profits

Trend Line Lightning: EUR/GBP Scalping Strategy for Quick Profits

Today, we’ll discuss the Trend Line Lightning: 1-Minute EUR/GBP Scalping Strategy for Quick Profits with Assh. Scalping is a trading technique that involves making multiple small trades in a short period. In this article, we’ll explore how to apply a 1-minute scalping strategy to the EUR/GBP pair using trend lines. Understanding Trend Lines Trend lines are a fundamental tool in technical analysis. They help traders identify trends and potential areas of support and resistance.Trend lines connect a series of highs or lows to reveal market direction. They enable you to spot uptrends, downtrends, or sideways movements.Uptrend lines act as support, while downtrend lines serve as resistance, helping you anticipate price bounces or breaks.By analyzing trend line slopes, angles, and breaks, you can confirm trend strength, identify reversals, and inform your trading decisions. How to Trade with Trend Lines Lightning Here is the question: How can you trade EUR/GBP Scalp using Trend Lines? First, draw uptrend lines below the price action and downtrend lines above to identify support and resistance levels, which will guide your buy-and-sell decisions.Secondly, trend line breaks can be used as trade signals: buy on bullish reversals and sell on bearish breaks, confirming with other technical indicators.Thirdly, set stop-losses below uptrend lines or above downtrend lines, adjusting for market volatility and trend strength to maximize trading opportunities.To trade with trend lines, follow these steps: Step 1: Set up your chart of Trend Lines Lightning Step2: Identify buy signals Step 3: Identify sell signals Tips and Tricks Risk Management of Trend Lines Lightning Risk management is crucial when trading with trend lines. Here are some tips to help you manage your risk: Overview in 5 second The 1-minute EUR/GBP scalp using trend lines is a powerful strategy. By combining trend lines with other indicators and managing your risk, you can maximise your trading potential. Trend Line Lightning” EUR/GBP scalping strategy: Profit potential: 10-50 pips per trade.Risk management: tight stop-losses, controlled position sizing.

Trend Line Lightning: EUR/GBP Scalping Strategy for Quick Profits Read More »

Scalping the USD/CAD with Fibonacci Retracement

USDCAD Scalping with Fibonacci Retracement

Learn Scalping the USD/CAD Trading Strategy with Assh. Scalping is a trading technique that involves making multiple small trades in a short period. In this article, we’ll explore how to apply a scalping strategy to the USD/CAD pair using Fibonacci Retracement levels. Understanding Fibonacci Retracement Fibonacci retracement is a popular technical analysis tool traders use to identify potential reversal levels in the market. It is based on the Fibonacci sequence, a series of numbers where each number is the sum of the two preceding ones. Key levels derived from this sequence, such as 23.6%, 38.2%, 50%, 61.8%, and 78.6%, are plotted on a price chart to indicate possible support and resistance levels. How to Calculate Fibonacci Retracement Fibonacci Retracement levels are calculated by applying Fibonacci ratios to a price chart. First, to calculate Fibonacci retracement levels, identify the high and low points of the price trend you’re analyzing. Then, the Fibonacci sequence ratios (23.6%, 38.2%, 50%, 61.8%, 78.6%) are applied to the difference between these points. Plot these levels on your chart to find potential support and resistance zones where the price might reverse. How to Trade with Fibonacci Retracement of USDCAD Scalping To trade with Fibonacci retracement, identify key levels (23.6%, 38.2%, 50%, 61.8%, and 76.4%) and look for reversals or breakouts.Use these levels to set buy/sell orders, stop losses, and take profits, adjusting for market volatility and trend direction.Combine Fibonacci retracement with other technical indicators, like moving averages or RSI, to confirm trading signals and maximize profitability. To trade with Fibonacci Retracement, follow these steps: Step 1: Set up your chart of USDCAD scalping Step 2: Identify buy signals Step3: Identify sell signals Risk Management of USDCAD Scalping Risk management is crucial when trading with Fibonacci Retracement. Here are some tips to help you manage your risk: Summary of the Article The USD/CAD scalp using Fibonacci Retracement is a powerful strategy. By combining this indicator with other tools and managing your risk, you can maximize your trading potential. Where to Get the Indicators: You can download the Fibonacci Retracement indicator for free from various online sources, including:

USDCAD Scalping with Fibonacci Retracement Read More »

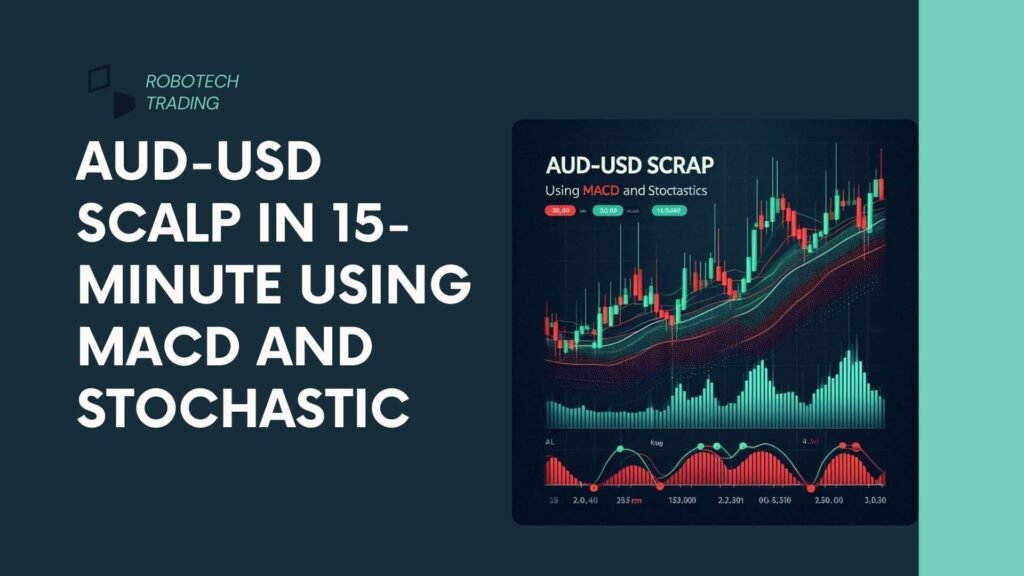
AUD-USD Scalp in 15-Minute using MACD and Stochastic

AUDUSD Scalp in 15-Minute using MACD and Stochastic

Today, we’ll discuss learning the AUD/USD Scalp in 15 minutes with Assh. Scalping is a trading technique that involves making multiple small trades in a short period. In this article, we’ll explore how to apply a 15-minute scalping strategy to the AUD/USD pair using MACD and Stochastic indicators. These two indicators are powerful tools for helping traders capitalize on small price movements. Understanding MACD and Stochastic MACD (Moving Average Convergence Divergence) measures the difference between two moving averages. It provides traders with valuable information about the trend direction and momentum. On the other hand, the Stochastic Oscillator measures the relative position of closing prices. It helps traders identify overbought and oversold conditions. How to AUDUSD Scalp Trade with MACD and Stochastic To trade the AUD-USD pair using MACD and Stochastic, follow these steps: Step 1: Set up your chart Step2: Identify buy signals Step 3: Identify sell signals Tips and Tricks for AUDUSD Scalp Techniques for AUDUSD Scalp Trading with MACD and Stochastic 1. Using MACD (Moving Average Convergence Divergence): 2. Using Stochastic Oscillator: Combining MACD and Stochastic: By combining these two powerful indicators, traders can improve their accuracy in identifying entry and exit points, leading to more successful trading outcomes. Summary of Article The 15-minute AUD/USD scalp using MACD and Stochastic is a powerful strategy. Combining these two indicators allows you to capitalize on small price movements and maximize your trading potential.

AUDUSD Scalp in 15-Minute using MACD and Stochastic Read More »

USD/JPY Breakout Scalping: Profits with Support and Resistance

USD/JPY Breakout Scalping: Profits with Support and Resistance

Let’s start learning Breakout Scalping Trading Strategy with Assh in one minute. Breakout scalping is a popular trading technique that involves identifying and capitalizing on key support and resistance levels. In this article, we’ll explore how to apply breakout scalping to the USD/JPY pair, one of the most liquid and volatile currency pairs in the Forex market. Understanding and Identifying Support and Resistance Support and resistance levels are essential components of technical analysis. These levels represent areas where buying pressure is strong enough to reverse price direction, while resistance levels indicate areas where selling pressure is strong enough to reverse price direction. Support and resistance levels are crucial concepts in technical analysis and are used to predict price movements. To identify support and resistance levels, traders can use various technical indicators, such as: To pinpoint support and resistance levels, traders can leverage a variety of technical indicators: By using these indicators, traders can better understand price movements and make informed decisions on entry and exit points in their trading strategies. How to Trade Breakouts on USD/JPY Trading breakouts on the USD/JPY pair involve capitalizing on sudden price movements that break through key support and resistance levels. These steps are essential strategies and techniques for effectively trading these breakouts for maximum profit. Step 1: Set up your chart Step2: Identify breakout levels Step 3: Manage your trades of USD/JPY Breakout Scalping Tips and Tricks for USD/JPY Breakout Scalping An Overview of USD/JPY Breakout Scalping Breakout scalping on the USD/JPY pair can be lucrative. You can capitalize on small price movements and maximize your trading potential by identifying key support and resistance levels and managing your trades effectively.USD/JPY breakout scalping is a dynamic trading strategy designed to capitalize on short-term price movements in the US Dollar/Japanese Yen currency pair. This approach identifies key support and resistance levels where the price will likely break out, providing opportunities for quick profits. Traders typically use technical indicators like trend lines, horizontal lines, Fibonacci retracement levels, and pivot points to pinpoint these critical levels.

USD/JPY Breakout Scalping: Profits with Support and Resistance Read More »

GBPUSD Scalp: Unlocking Profits with RSI and Bollinger Bands

Learn Scalping Trading Strategy in Three minutes with Assh. Are you looking for a reliable GBPUSD pair scalping strategy? This article will guide you through the 5-Minute GBPUSD Scalp using RSI and Bollinger Bands.Firstly, we”ll discuss about Scalping. GBPUSD Scalp Strategy Scalping involves making multiple small trades in a short period. It’s ideal for traders who want to capitalize on small price movements.GBP/USD scalping is a high-frequency trading strategy designed to profit from small price movements in the British Pound/US Dollar currency pair over very short time frames. Scalpers aim to capture and capitalize on rapid price fluctuations for quick profits.Secondly, we’ll briefly discuss the Relative Strength Index (RSI) and Bollinger Bands. What are RSI and Bollinger Bands? RSI (Relative Strength Index) measures price strength. Bollinger Bands measure volatility. How to Trade with RSI and Bollinger Bands Trading with RSI (Relative Strength Index) and Bollinger Bands can be powerful for identifying potential buy and sell signals in the financial markets. Moreover, the RSI measures the speed and change of price movements, helping traders identify overbought or oversold conditions. Bollinger Bands, on the other hand, consist of a moving average and two standard deviation lines, providing a visual representation of volatility and potential price reversals. By combining these two indicators, traders can gain valuable insights into market trends and make more informed trading decisions. The following steps teach you the basics of using RSI and Bollinger Bands to enhance your trading strategy. Step 1: Set up your chart for the GBPUSD Scalp Step 2: Identify buy signals Step3: Pin down sell signals Overview of GBPUSD Scalp The 5-Minute GBP/USD Scalp using RSI and Bollinger Bands is a powerful strategy for capitalizing on small price movements. Firstly, GBP/USD scalping is a high-frequency trading strategy that aims to profit from small price movements in the British Pound/US Dollar currency pair over very short time frames. By combining the Relative Strength Index (RSI) and Bollinger Bands, traders can enhance their ability to identify potential buy and sell signals, ultimately unlocking greater profits. Secondly, RSI helps traders determine overbought or oversold conditions by measuring the speed and change of price movements. Bollinger Bands, consisting of a moving average and two standard deviation lines, visually represent volatility and potential price reversals. Thirdly, these tools offer valuable insights into market trends, helping traders make more informed decisions.

GBPUSD Scalp: Unlocking Profits with RSI and Bollinger Bands Read More »