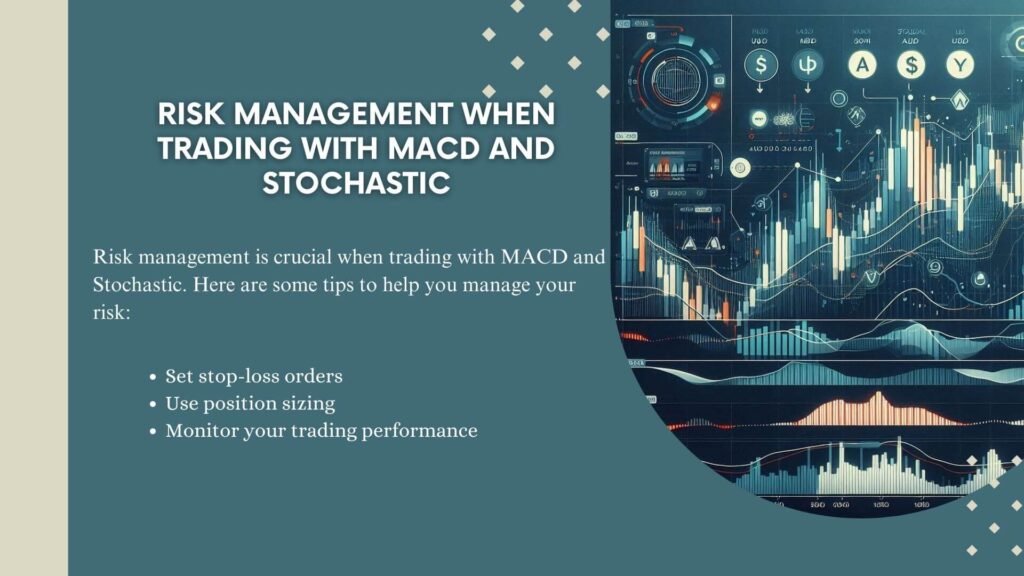
Today, we’ll discuss learning the AUD/USD Scalp in 15 minutes with Assh. Scalping is a trading technique that involves making multiple small trades in a short period. In this article, we’ll explore how to apply a 15-minute scalping strategy to the AUD/USD pair using MACD and Stochastic indicators. These two indicators are powerful tools for helping traders capitalize on small price movements.
Table of Contents
ToggleUnderstanding MACD and Stochastic
MACD (Moving Average Convergence Divergence) measures the difference between two moving averages. It provides traders with valuable information about the trend direction and momentum. On the other hand, the Stochastic Oscillator measures the relative position of closing prices. It helps traders identify overbought and oversold conditions.
How to AUDUSD Scalp Trade with MACD and Stochastic
To trade the AUD-USD pair using MACD and Stochastic, follow these steps:
Step 1: Set up your chart
- Firstly, choose the AUD/USD pair
- Secondly, set the time frame to 15 minutes
- Thirdly, add MACD (12, 26, 9) and Stochastic (14, 3, 3)
Step2: Identify buy signals
- Wait for MACD to cross above the signal line
- Wait for Stochastic to rise above 20
- Then, buy the AUD/USD pair
- Set stop-loss below the recent low
- Moreover, take profit at the next resistance level
Step 3: Identify sell signals
- Firstly, wait for MACD to cross below the signal line
- Secondly, wait for Stochastic to fall below 80
- Thirdly, sell the AUD/USD pair
- Then, set the stop-loss above the recent high
- Take profit at the next support level

Tips and Tricks for AUDUSD Scalp
- Firstly, use multiple time frames to confirm signals
- Secondly, combine MACD and Stochastic with other indicators
- Thirdly, monitor economic news and events
Techniques for AUDUSD Scalp Trading with MACD and Stochastic
1. Using MACD (Moving Average Convergence Divergence):
- Signal Line Crossover: Look for the MACD line crossing above the signal line for a buy signal and below the signal line for a sell signal.
- Divergence: Attention divergences between the MACD and price action can indicate potential reversals.
- Histogram Analysis: Monitor the MACD histogram to gauge the trend’s strength. Increasing histogram bars suggest strengthening momentum, while decreasing bars indicate weakening momentum.
2. Using Stochastic Oscillator:
- Overbought and Oversold Levels: The Stochastic Oscillator ranges from 0 to 100. Readings above 80 suggest overbought conditions, while readings below 20 indicate oversold conditions.
- Stochastic Crossovers: Watch for the %K line to cross above the %D line for a bullish signal and below the %D line for a bearish signal.
- Divergence: Similar to MACD, divergences between the Stochastic Oscillator and price action can hint at potential trend reversals.
Combining MACD and Stochastic:
- Confirm Signals: Use the Stochastic Oscillator to confirm signals the MACD generates. For example, if the MACD gives a buy signal and the Stochastic is in oversold territory, the buy signal will be strengthened.
- Filter Trades: Use the MACD to identify the general trend and the Stochastic to fine-tune entry and exit points.
- Divergence Confirmation: Look for instances where both the MACD and Stochastic show divergence from price action to increase the reliability of potential reversals.
By combining these two powerful indicators, traders can improve their accuracy in identifying entry and exit points, leading to more successful trading outcomes.
Summary of Article
The 15-minute AUD/USD scalp using MACD and Stochastic is a powerful strategy. Combining these two indicators allows you to capitalize on small price movements and maximize your trading potential.


